15% off your first subscription blood test
15% off your first subscription blood test
Thriva Year in Health Report 2025: What our most popular tests reveal about Healthspan


Written by Katie Yockey, ANutr
14th Jan 2026 • 7 minute read

Reviewed by
Dr Lucas DentonA big part of our mission at Thriva is giving our users as much insight into their health as possible. We think community data is a powerful way to do that, so at the end of the year, we take some time to dig into the numbers and draw out interesting insights.
We had more users and tests this year, which means we had a larger pool of data to analyse—and we’re thrilled to share our findings with you.
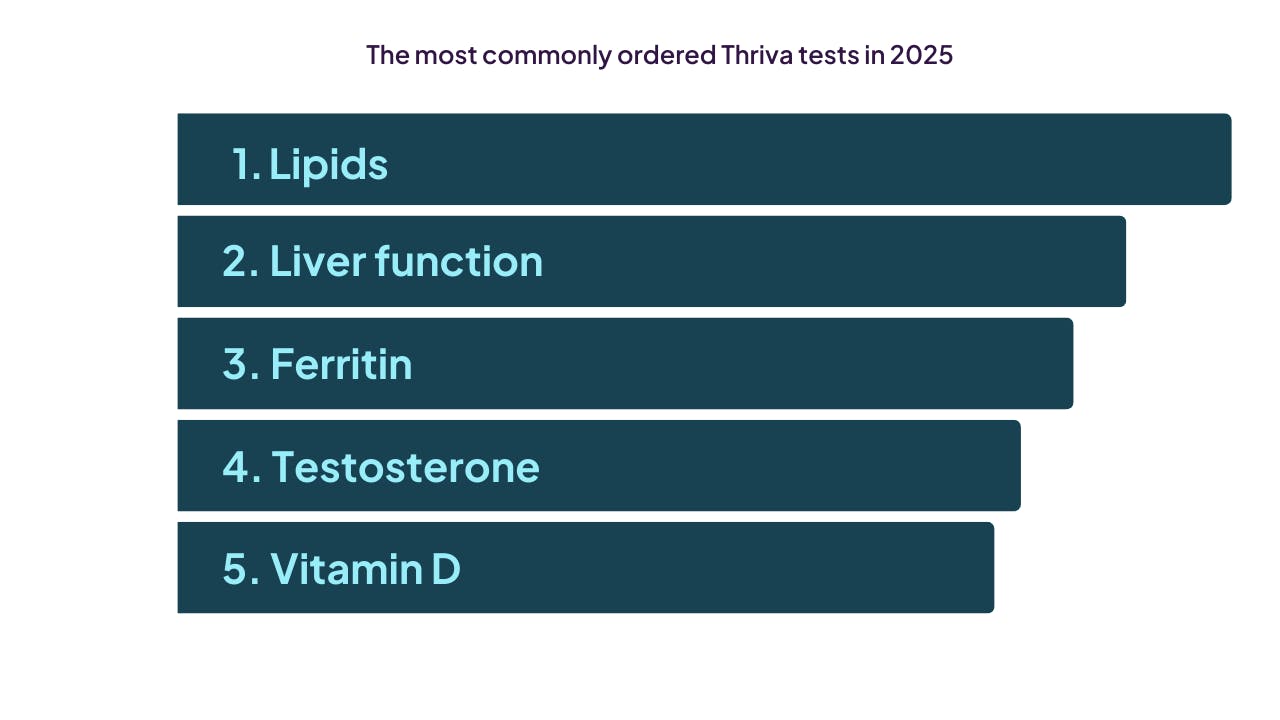
The most popular tests of 2025
In 2025, our most frequently ordered tests were those relating to lipids, such as triglycerides, LDL cholesterol, and HDL cholesterol. These were followed by liver function, ferritin, testosterone, and vitamin D.
Let’s delve into the data to share some of the interesting insights and trends we saw across all Thriva users.
Correlation vs. causation
But before that, let’s briefly pause to discuss correlation vs. causation.
Two things are correlated if they’re related to each other. For example, ice cream sales and sunburns are correlated because they both occur more often in summer and less often in winter.
However, higher ice cream sales don’t cause sunburns—they’re just two events that are more common during the warmer months.
The same is true for blood test results. Patterns between blood test results and other variables could just be a correlation, not one causing the other.
We also have to consider the inherent bias within our data set. If you’re regularly taking Thriva tests, it’s more than likely that you have an interest in your health. This could mean our findings are biased towards people who are more invested in getting healthier.
Lipids
Our most popular tests were those making up a lipid profile, which includes measures of various fats in the blood, like LDL cholesterol, HDL cholesterol, and triglycerides.
Cholesterol is an important measure of cardiovascular disease risk. One test which didn’t make it onto our leaderboard is Apolipoprotein B (ApoB), which is considered a more accurate predictor of one’s risk than other cholesterol markers.
When we looked at our health data for LDL cholesterol, we noticed a clear divergence by gender. For men, elevated cholesterol levels increased steadily over time, then began to decline around 55-59.
But for women, the trajectory was very different. Levels rose gradually, then sharply increased around age 50-54, which is around when menopause typically occurs.
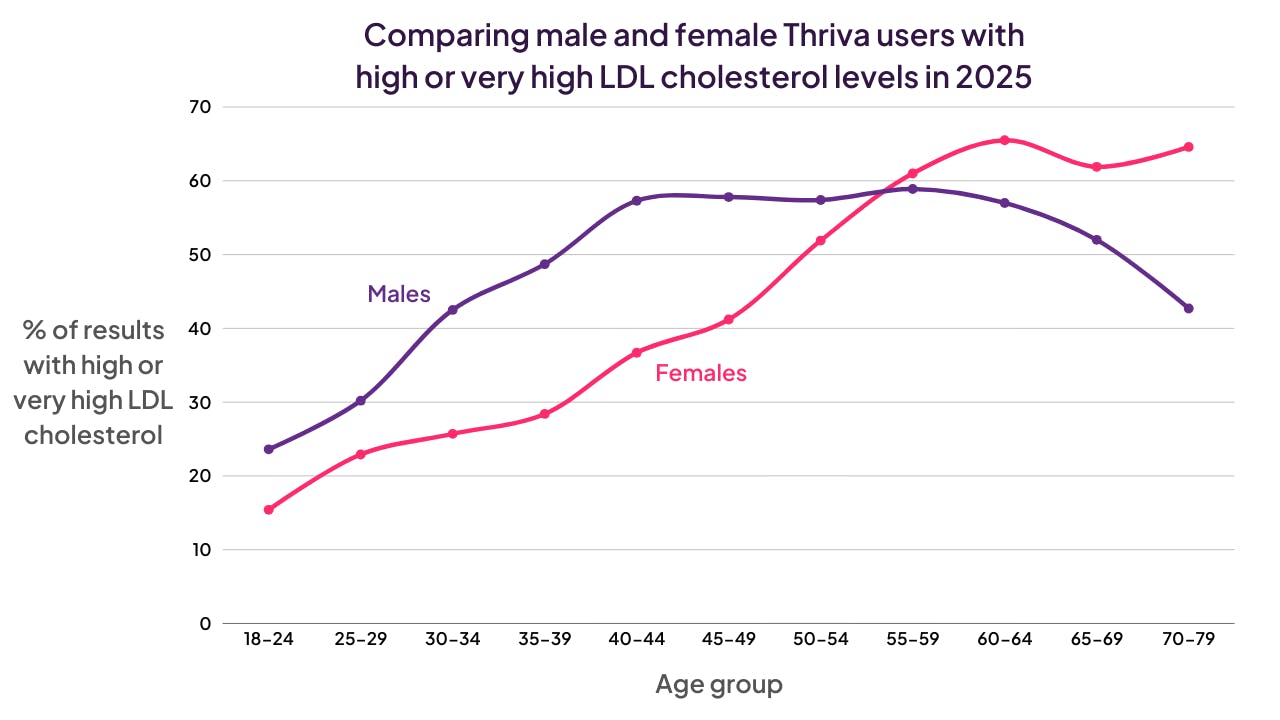
The hormonal shift that happens during and after menopause means that oestrogen levels decline. Because oestrogen helps to maintain healthy cholesterol levels, the hormonal shift means cholesterol levels can go up.
However, we found that our male users were twice as likely to use statins, a type of medication that reduces LDL cholesterol. Statin use nearly tripled from the 50-59 and 60-69 age brackets among men. This could explain why the graph curves downward for men but not women—because women aren’t taking statins at the same rate.
While the increase in cholesterol is a natural response to changing hormones in women, it’s crucial that they are empowered with the knowledge to take care of their health.
Anecdotally, we’ve seen Thriva users (and team members!) point to the value of tracking biomarkers as part of living a healthy life. Our own Dr Lucas Denton shared his own journey improving ApoB and other health markers, and many of our users told us about the lifestyle changes they made when reducing their LDL cholesterol levels.
Ferritin
Iron helps your red blood cells carry oxygen around the body, and it’s essential for maintaining your energy levels and ensuring your immune system functions properly.
Ferritin is one of the biomarkers you’ll see in an iron profile test, so it’s important to note here that it doesn’t tell the full story when it comes to iron status. However, ferritin plays an important role as your body’s stored iron, and your body uses it as a reserve to regulate your overall iron levels.
Our health data shows that low ferritin levels were more common in women than men, which is what we’d expect based on population data. However, we saw an interesting trend when we broke it down by sex and age.
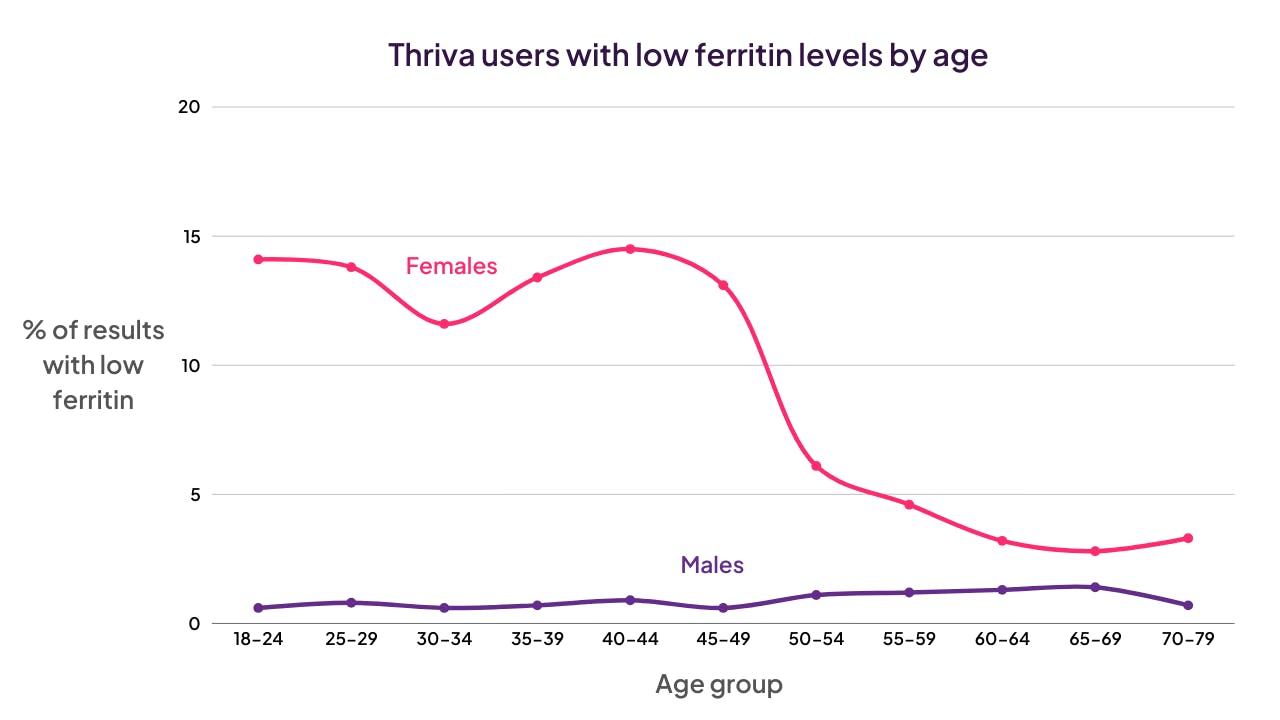
For women, the proportion with low ferritin levels decreased with age. Iron deficiency is commonly seen in females during reproductive years because iron, and therefore ferritin, can be lost through menstruation. Seeing this shift with age is consistent with changes that occur during and after menopause.
On the other hand, low ferritin was far less common in male Thriva users, and rates remained fairly consistent regardless of age.
Testosterone
While testosterone is sometimes considered a male hormone, it’s also crucial for female health. Females require lower levels, but they need enough testosterone to support muscle maintenance, bone density, and energy levels.
We found this interesting because our data showed that most users testing their testosterone were male. Nearly 70% were taken by men when compared to 57% across all our tests, suggesting that females may be under-testing a marker that’s also important for their health and performance.
Interestingly, our health data showed that while most female users had normal free testosterone levels, there was a marked drop around age 45-49. This aligns with the onset of menopause, which typically occurs around ages 45-55, and causes declining testosterone levels.
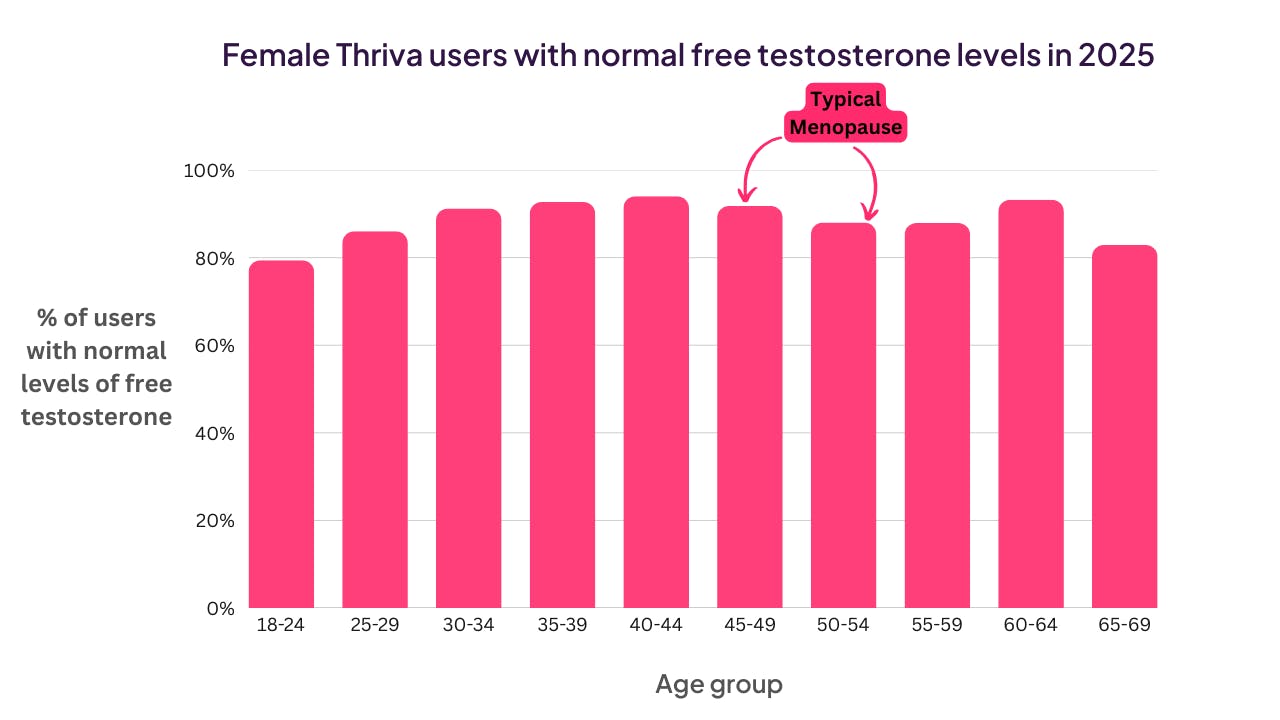
It’s important to note that a decrease in testosterone is a natural, expected change that occurs around menopause.
Interestingly, this graph shows an uptick in the 60-64 age group. This might be explained by women taking testosterone replacement therapy (TRT). According to our data, females aged 50-64 taking TRT had free testosterone levels of 0.034 nmol/L compared to 0.010 nmol/L among those not taking it.
For men, the maintenance of normal testosterone levels remained fairly stable, with small and gradual declines in older age. This is consistent with the evidence—testosterone does decline with age, but around 75% of men maintain normal levels into old age. Other factors play a role, such as health status, obesity, and health conditions like diabetes and cardiovascular disease.
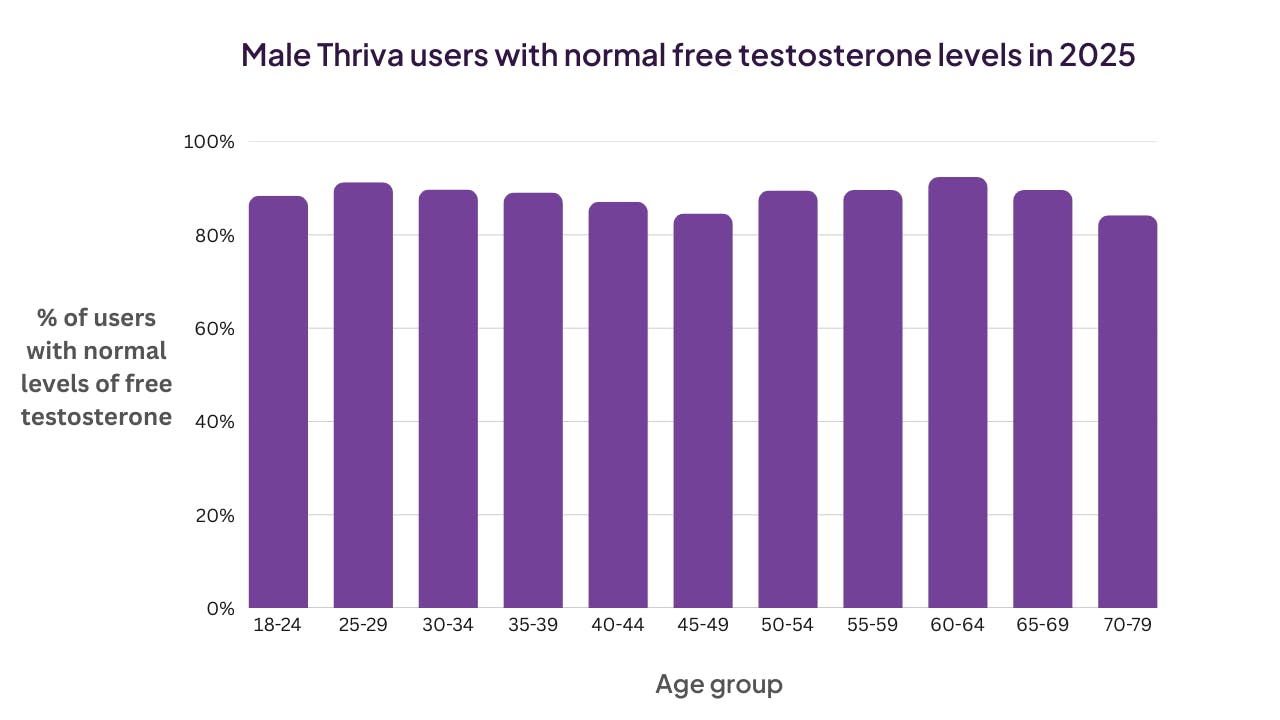
It’s worth noting that the reference ranges for testosterone change with age, which explains why the number of men in the ‘normal’ range remained fairly stable across age groups:
- Males aged 16-50: 8.64-29.0 nmol/L
- Males over age 50: 6.68-25.7 nmol/L
Given testosterone's role in maintaining muscle mass, bone health, and energy, these patterns show us the importance of testing for everyone, not just men.
Vitamin D
Vitamin D, a nutrient we get mostly from sun exposure, plays a crucial role in bone health, immune function, and mood regulation. In the UK, weak sun rays in the winter months make supplementation important for most people.
In 2024, we conducted a survey of Thriva users and found that about 1 in 3 people weren’t taking vitamin D supplements—and among them, just 19.7% had optimal vitamin D levels.
When comparing those who did and didn’t supplement, we saw much lower rates of low vitamin D in those who supplemented, even in winter.
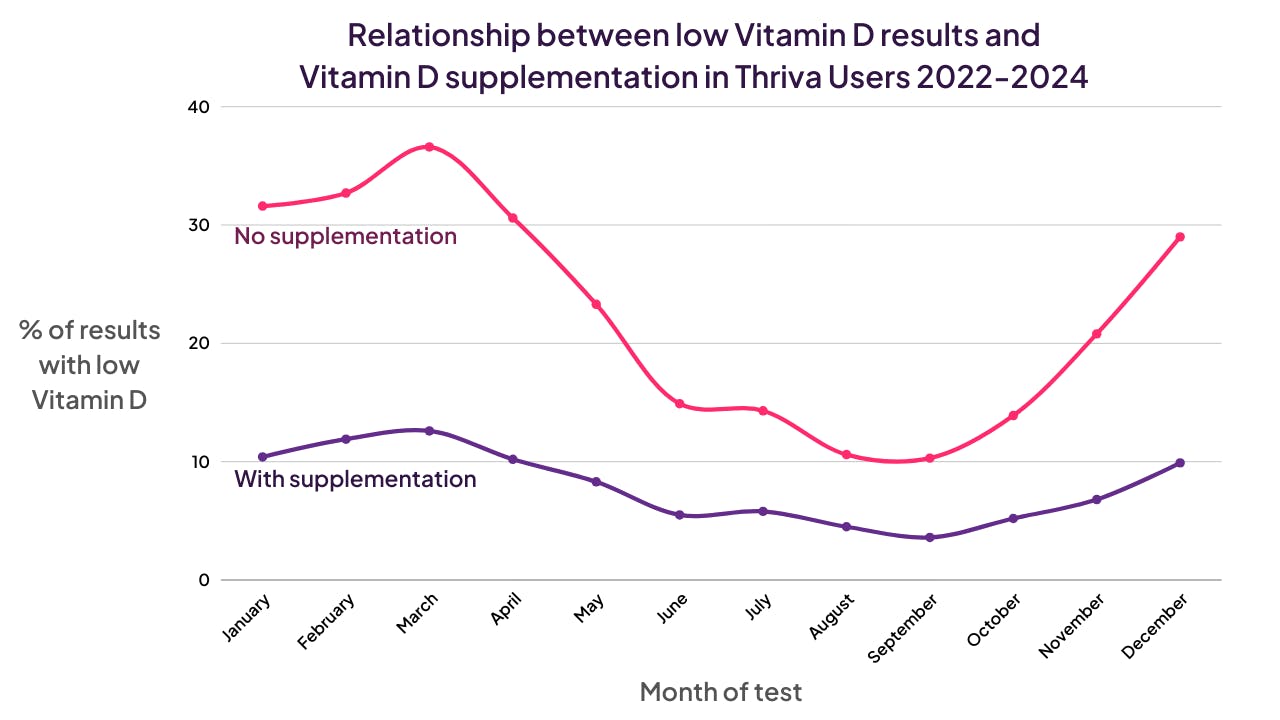
This year’s data affirms that we know supplementation works. Of users who took vitamin D supplements, 91% had sufficient to optimal levels.
But more importantly, we saw that individuals were able to improve their levels. Of people who had low vitamin D in their first test, 83.4% showed significant improvement by their second test.
This shows us that low vitamin D is very manageable with dietary changes and supplements, and tracking biomarkers can help create measurable improvements in our health.
That's a wrap
These insights from thousands of Thriva users reveal patterns across how age, sex, lifestyle, and behaviours show up in biomarker data. Seeing trends among your peers can help deepen your own understanding of your health, and we hope this year’s analysis empowered you with information from other users.
We’re all on our own journeys, and we all have health areas we’re working to improve.
We think it’s important to know that out-of-range results shouldn’t cause panic. Being informed about what’s going on in your body is powerful, and we want you to take your results and use them to create healthy changes that make you feel better now and in the long term.
Health isn’t defined by a single test. Tracking your biomarkers over time and seeing how lifestyle changes influence your metrics helps you build a complete picture of health.
Catch up on our 2024 Year in Health Report.
We’ve recently updated the Thriva app to include wearable data integration as well as physical markers of longevity. It brings all your health data together for a more detailed, impactful view of your health. Update your Thriva app to explore your new Healthspan Dashboard.
- Anonymised Thriva user data, 2025
- Barone, B. et al. (2022). The role of testosterone in the elderly: What do we know? https://pubmed.ncbi.nlm.nih.gov/35408895/
- Kotla, N. et al. (2022). The role of ferritin in health and disease: Recent advances and understandings. https://pmc.ncbi.nlm.nih.gov/articles/PMC9320524/
- NHS. (2020). Vitamin D. https://www.nhs.uk/conditions/vitamins-and-minerals/vitamin-d/
- NHS. (2022). Menopause. https://www.nhs.uk/conditions/menopause/
- Petraglia, F. & Dolmans, M. (2022). Iron deficiency anemia: Impact on women’s reproductive health. https://pubmed.ncbi.nlm.nih.gov/36182259/