15% off your first subscription blood test
15% off your first subscription blood test
Exploring Vitamin D Levels in Winter
What's covered?


Written by Fraser Young
28th Jan 2025 • 6 minute read

Reviewed by
Dr Noel Young MBBS BSc, MedicineEvery winter, from approximately mid-October through to mid-February, sun exposure in the UK is not sufficient for our bodies to produce adequate Vitamin D. Throughout these winter months, supplementation becomes all the more important. However, data from Thriva user’s health profiles show that 1 in 3 users are not taking supplements, meaning they are potentially at risk of low Vitamin D levels.
To explore the link between supplement dosage and blood test results, we surveyed users when they returned their blood samples. Across November, December and January, we received more than 600 responses, and we’d like to thank everyone who participated in our research and gave consent for their data to be shared.
Here we will present the results of the survey, alongside other health profile data with links to Vitamin D levels.
How much Vitamin D are Thriva users taking?
Survey results reflect broader health profile data, showing that 65% of users take Vitamin D supplements. But how much are they taking?
Among those who knew their dosage, 11.8% reported taking 400 IU or less, 25.3% took up to 1000 IU, and 34.3% were on the upper recommended limit of 3000–4000 IU per day.
So, how does this impact Vitamin D levels? Let’s explore how these dosages influenced blood test results to identify what might work best for you.
What dosage of Vitamin D supplement should you take?
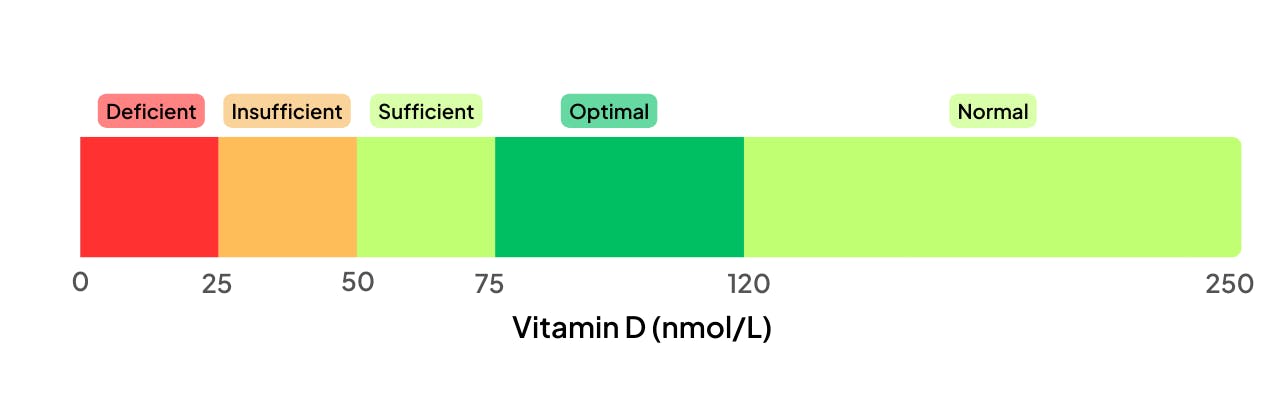
To determine your ideal dosage, it’s important to aim for blood Vitamin D levels in the optimal range of 75–120 nmol/L. Here’s a reminder of Thriva’s current reference ranges for Vitamin D.
Using data from the past few months, we analysed how supplement dosages influence blood test results.
The chart below plots each individual user based on their supplement dosage and the corresponding Vitamin D result from their blood test. Users who travelled abroad in the last 6-8 weeks were excluded, as sunlight can boost Vitamin D levels higher than supplementation alone.

You can hopefully see a trend for higher levels as supplement dosage increases, but also a wide variation in individual responses. This suggests that other factors influence Vitamin D requirements, which we’ll cover later on.
As far as optimising Vitamin D levels:
- With no supplementation, fewer than 20% of users were in the optimal range.
- For doses up to 1000 IU/day, around 40% achieved optimal levels.
- Of the users taking 1500–4000 IU/day, over 50% were in the optimal range.
While the NHS recommends everyone take 400 IU, this is a very broad guideline and it’s worth considering a more personalised approach based on your specific needs.
The same data can be displayed in aggregation, comparing the average Vitamin D result by supplement dose. Again, this graph is excluding users who have been abroad.

Presented in this way, there is a clear linear relationship between supplement dosage and Vitamin D levels, at least for the range of doses surveyed. On average, each additional 1000 IU raises blood levels by 10.3 nmol/L, consistent with existing research estimating a rise of 12.5–22.5 nmol/L per 1000 IU [1].
With that in mind, one of the simplest ways to determine your optimal dose is to experiment for yourself. If you’ve been consistently taking a certain dosage of Vitamin D supplement throughout winter, consider measuring your blood levels in January or early February. This way you will be able to see whether supplementation has had the desired effect.
Which other factors have the biggest impact on Vitamin D levels?
Body Mass Index
Being overweight or obese is associated with a reduced response to Vitamin D supplementation [2]. This is based on Body Mass Index (BMI), which takes into account a user’s height and weight. While BMI doesn’t reflect body composition, it is used as a general indication of healthy weight at the population level.

Here we’ve been able to take Vitamin D results from all Thriva users this winter and compare to the height and weight from their health profile. We see that users with a “Healthy” weight, as defined by a BMI of 18.5 to 24.9, have higher Vitamin D levels than the “Overweight” or “Obese” groups. Note also a larger effect in females, likely due to higher average body fat levels than males [3]. Obese women had, on average, Vitamin D levels 15 nmol/L lower than those of a healthy weight.
Dietary Vitamin D intake
While we have controlled for sun exposure and grouped by supplement dosage, we have yet to explore dietary Vitamin D intake. This is typically quite small, the UK National Diet and Nutrition Survey found that the average UK adult only consumed 120 IU/day from food sources [4].
In our Thriva user survey we asked whether users regularly consumed certain high Vitamin D foods. This table shows the difference in average Vitamin D levels based on food survey responses for the 183 users not taking supplements.

It’s important to note that the average differences will not be due to that single food type. For instance, users who consume salmon are more likely to consume other fatty fish and egg yolks, and so by asking people their salmon intake we are also capturing users who are more likely to eat other Vitamin-D rich foods. Salmon, one of the richest sources of Vitamin D, provides about 500 IU per portion, which shows how challenging it is to rely solely on diet for adequate levels.
The key results are those who consumed any of the surveyed foods, who see an increase of 12.3 nmol/L on average, and those who spent time in sunlight outside the UK, with an increase of 16.5 nmol/L. These can both be compared to the 10.3 nmol/L increase observed from an additional 1000 IU/day of supplementation.
Finally, the statistical significance column highlights whether these differences are likely due to chance. We’ve used a p-value below 0.01, which is a common threshold for significance. While the effect for egg yolks is statistically significant, it may also reflect a broader trend, such as identifying vegan users, who are at higher risk of Vitamin D deficiency due to the animal-based nature of most dietary sources.
Summary & next steps
What can we take away from these results? With only 19.7% of users in the optimal range without supplementation, it’s clear that diet alone may not provide sufficient Vitamin D levels in the UK winter. This is especially true if your diet doesn’t contain many of the Vitamin D-rich foods such as fatty fish, fortified foods or egg yolks.
Here are some next steps to support your Vitamin D levels:
- If you aren’t already, consider taking a daily supplement* of 1000–4000 IU Vitamin D in winter.
- Check your blood levels in January or February to test your status.
- Incorporate Vitamin D-rich foods like fatty fish into your diet.
- Maintain a healthy weight to improve your body’s response to supplementation.
*if you are known to have high calcium levels please speak with your GP before taking any supplements
Winter is a great time to test Vitamin D levels, as it’s the most common time for deficiencies to appear. We hope you have found these results useful, and that they help bring you one step closer to optimal health.
[1] Human serum 25-hydroxycholecalciferol response to extended oral dosing with cholecalciferol. R Heaney, K Michael Davies, T C Chen, M F Holick, M J Barger-Lux, 2003
[2] Association of Body Weight With Response to Vitamin D Supplementation and Metabolism. D K Tobias, H Luttmann-Gibson, S Mora, 2023.
[3] Sex Differences of Vitamin D Status across BMI Classes: An Observational Prospective Cohort Study. G Muscogiuri, L Barrea, C Di Somma, D Laudisio, C Salzano, G Pugliese, G de Alteriis, A Colao, S Savastano, 2019
[4] UK National Diet and Nutrition Survey 2016-2019, Data table NDNS Y9_11_DESCRIPTIVE STATISTICS TABLES_FINAL-2, Table 5.6 Micronutrient intakes from food sources only; Vitamin D by NDNS RP survey years, age and sex