15% off your first subscription blood test
15% off your first subscription blood test
How optimal blood test ranges work: Thriva’s approach
What's covered?


Written by Vishal Shah - Thriva Chief Medical Officer
23rd Apr 2026 • 4 minute read

Reviewed by
Dr Noel Young MBBS BSc, MedicineYou get your blood test results back. Everything’s “normal.” But what does that actually mean, and is normal the same as good?
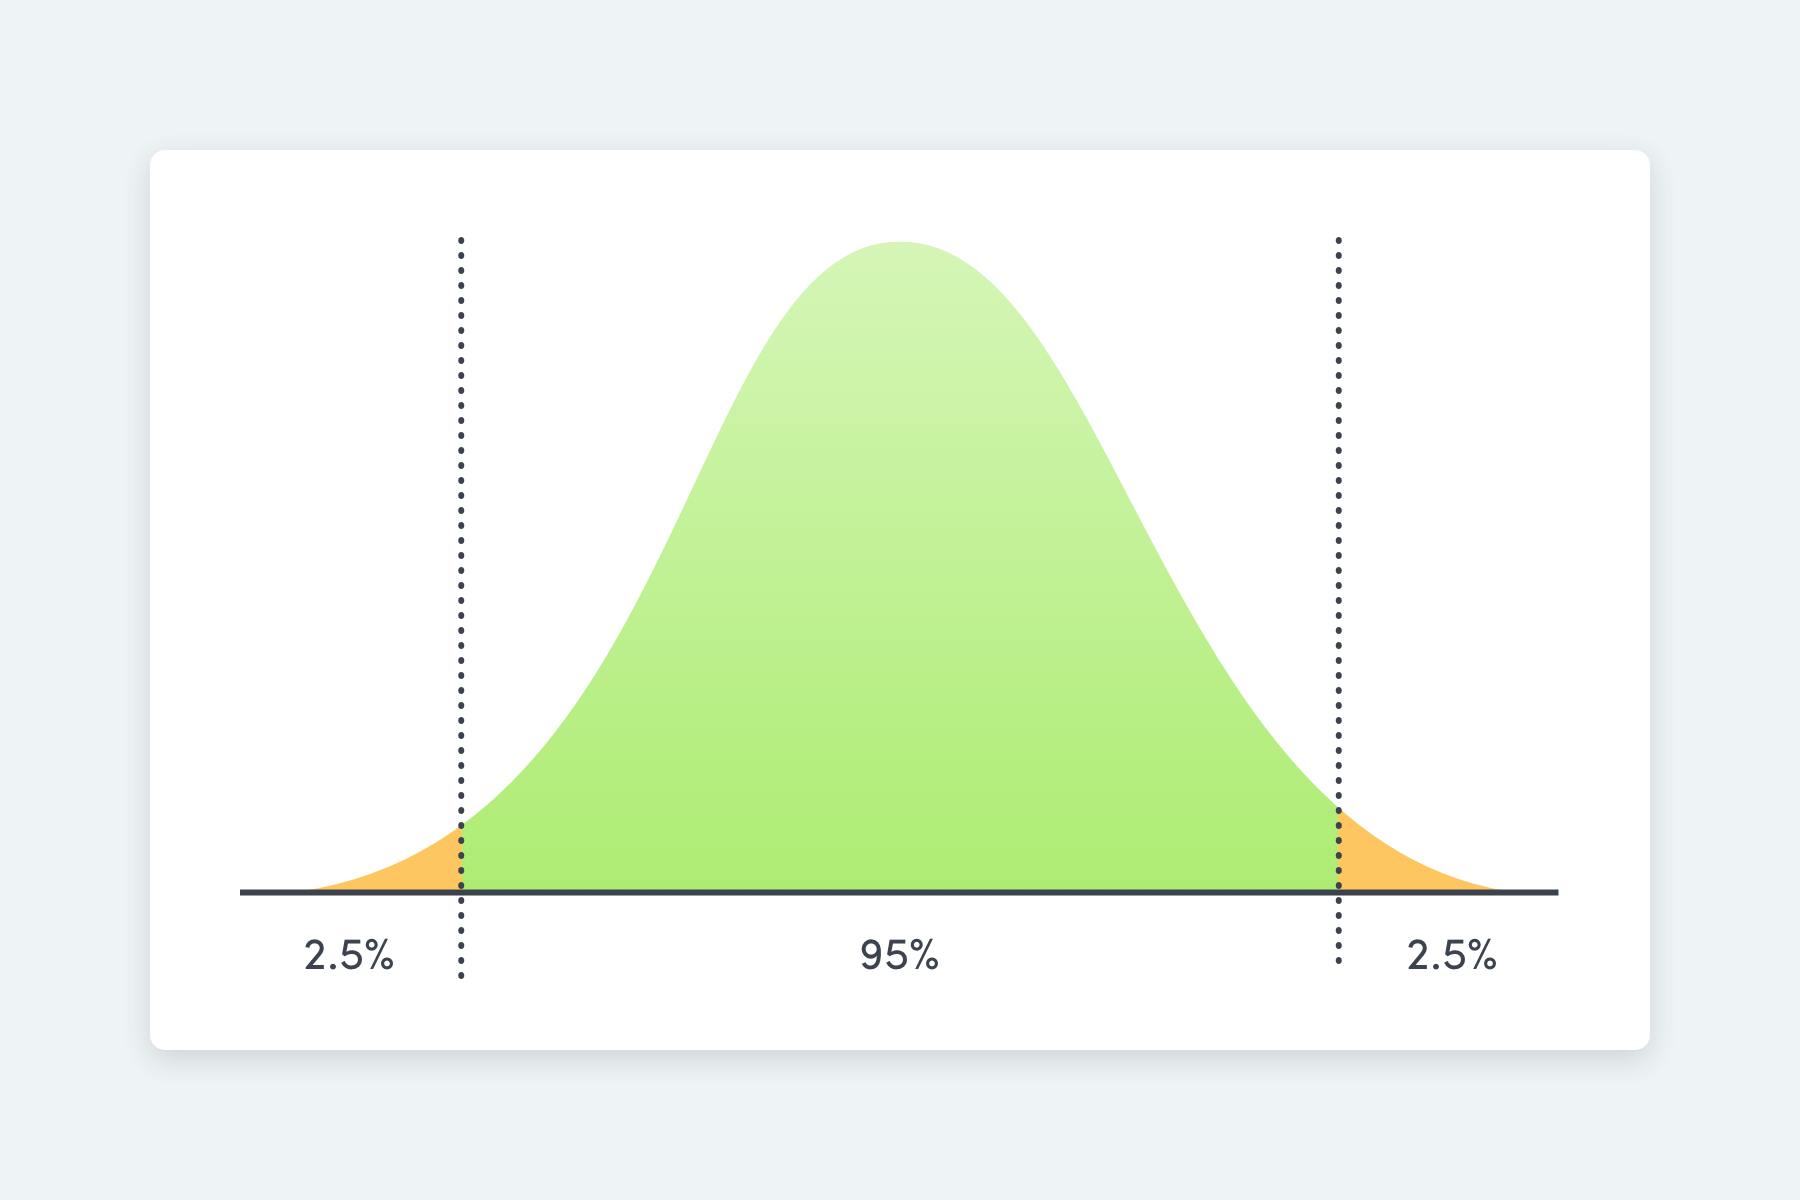
Standard reference ranges tell you whether your levels fall within the range seen in 95% of the general population.
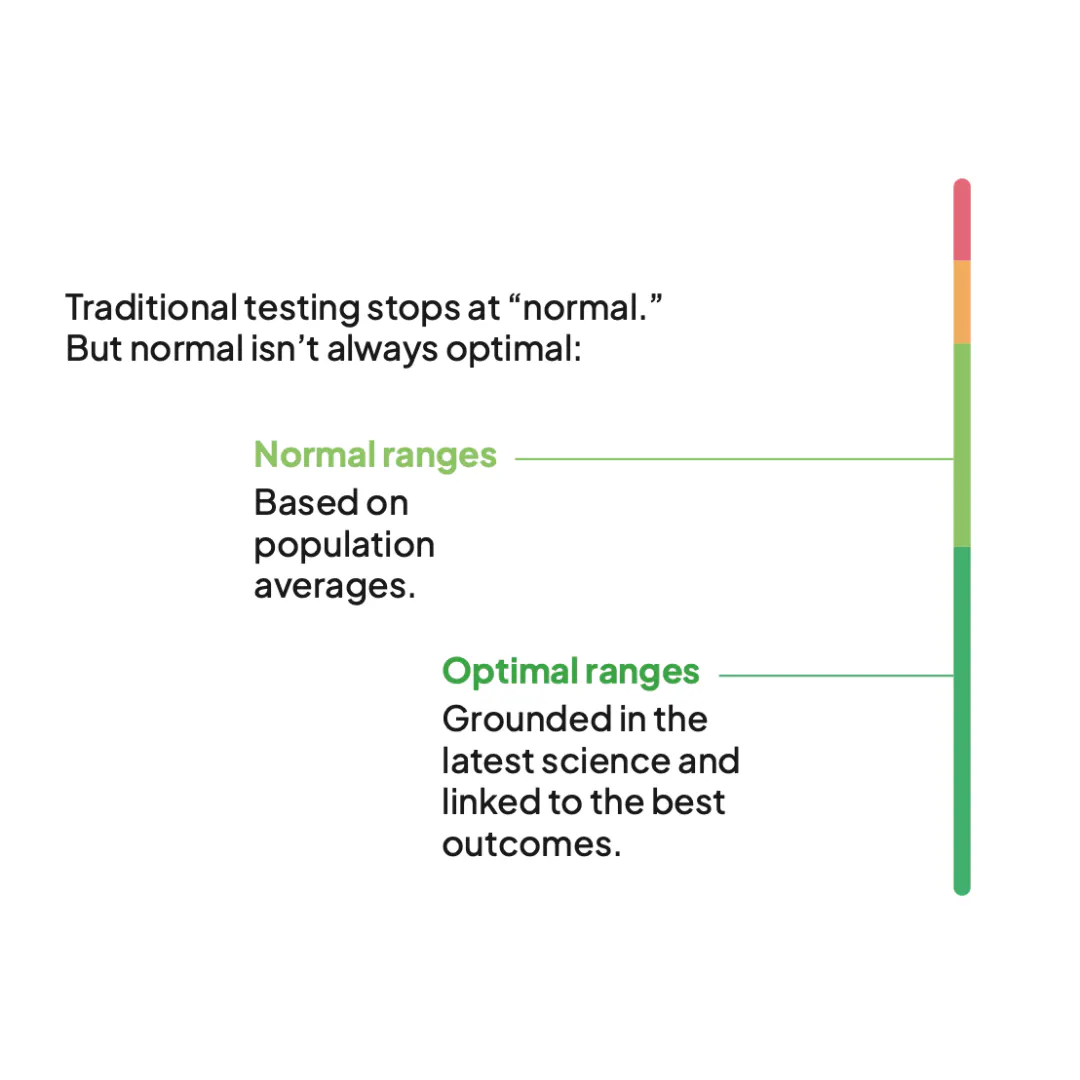
While it can help you spot clear abnormalities, it doesn’t tell you much about where your levels sit in relation to long-term health and longevity. That’s where optimal ranges come in.
In this article, we explain what optimal ranges are and how we use them at Thriva.
What are normal blood test reference ranges?
Normal reference ranges are the values used to interpret your blood test results. They’re how your GP decides whether something is “normal” or “abnormal.” These ranges are typically based on where 95% of a sample population falls.
Some ranges are set based on evidence linking specific levels to disease risk. Cholesterol reference ranges, for example, are influenced by their association with heart disease.
Why “normal” blood test results aren’t always enough
There are several limitations to normal reference ranges:
- They often oversimplify the complex nature of health.
- They do not always consider the relationship between specific levels and disease risk or life expectancy.
- The research behind these ranges can rely on small sample sizes.
- Reference range populations might include individuals who are not entirely healthy, or who are at high risk of future disease.
Optimal reference ranges can help us overcome some of these limitations.
What are optimal blood test ranges?
At Thriva, we use a refined approach to establish optimal reference ranges. Our clinical team systematically reviews the latest scientific literature and clinical guidelines to identify ranges that are associated with improved health outcomes and longevity. This approach provides a more comprehensive understanding of your health beyond traditional reference ranges.
Optimal ranges are based on evidence linking specific levels of an analyte (a substance measured in a blood test) with a reduced risk of disease or enhanced life expectancy.
Take vitamin D as an example. Traditional vitamin D guidelines suggest that:
- Levels below 25 nmol/L indicate deficiency.
- Levels above 50 nmol/L are considered sufficient
This range is only based on the relationship between vitamin D, your bone health, and your risk of osteoporosis.
However, vitamin D is important for many other things, like your muscle and immune health. So the evidence suggests that the optimal range for vitamin D is actually between 75 nmol/L and 100 nmol/L — this is associated with the lowest risk of death (from all causes).
How to interpret optimal ranges
It’s important to understand that optimal ranges are not always straightforward, and interpreting them requires a nuanced approach. While they are associated with better health outcomes, correlation does not always imply causation. Adjusting biomarkers to fit within these ranges does not automatically guarantee improved health, as the evidence can be complex and direct cause-and-effect relationships are not always clear. At Thriva, we base our recommendations on the most reliable evidence available.
Given these complexities, we don't suggest that targeting optimal levels for every biomarker is the only way to achieve better health and wellbeing. Instead, we encourage you to use optimal ranges as helpful guides to identify areas for improvement, while considering your overall health, lifestyle, and any existing medical conditions. Our doctors are here to provide personalised advice, tailored to your unique health needs and goals.
Takeaway
Normal reference ranges are useful for spotting clear abnormalities, but they don’t always give you the full picture.
Optimal ranges offer a more refined view, showing you where your results sit in relation to the latest evidence on disease risk and longevity. Think of them as a more ambitious benchmark, not a rigid target.
Frequently asked questions
What does “normal” mean on a blood test?
A “normal” result means your levels fall within the reference range used by the lab, which is typically the range where 95% of the general population sits. It rules out obvious abnormalities but doesn’t necessarily mean your levels are ideal for long-term health.
Are optimal ranges the same for everyone?
Not always. While optimal ranges are based on population-level evidence, what’s optimal for you can depend on your age, sex, health history, and lifestyle. They’re a useful starting point, but interpreting them in context is important.
Should I worry if my results are normal but not optimal?
Not necessarily. Optimal ranges highlight areas where there may be room for improvement, but a result in the normal range isn’t cause for concern on its own. If something is consistently at the edge of a range or you have symptoms, it’s worth discussing with a doctor.
How does Thriva calculate optimal ranges?
Our clinical team reviews the latest scientific literature and clinical guidelines to identify ranges associated with the lowest risk of disease and improved life expectancy. These ranges are continually updated as new evidence becomes available.
- Pilz, S. et al. (2025). The optimal protective 25-hydroxyvitamin D level for different health outcomes in adults: a brief summary of dose–response meta-analyses. https://pubmed.ncbi.nlm.nih.gov/40278393/
- Razvi, S. et al. (2023). The optimal healthy ranges of thyroid function defined by the risk of cardiovascular disease and mortality: systematic review and individual participant data meta-analysis. https://pubmed.ncbi.nlm.nih.gov/37696273/
- Sempos, C. et al. (2013). Is there a reverse J-shaped association between 25-hydroxyvitamin D and all-cause mortality? Results from the US nationally representative NHANES. https://pubmed.ncbi.nlm.nih.gov/23666975/
- Spencer, C. et al. (2007). National Health and Nutrition Examination Survey III TSH–thyroperoxidase antibody relationships demonstrate that TSH upper reference limits may be skewed by occult thyroid dysfunction. https://pubmed.ncbi.nlm.nih.gov/17684054/
- Yi, S. et al. (2019). Total cholesterol and all-cause mortality by sex and age: a prospective cohort study among 12.8 million adults. https://pubmed.ncbi.nlm.nih.gov/30733566/


