Does the time of day you take a blood test affect your results?
What's covered?


If you've ever done a blood test in the afternoon and received an unexpected result, the timing of your sample may be to blame. For a handful of biomarkers with strong diurnal variation, the time of day you take a blood test can meaningfully shift results.
Some biomarkers fluctuate across a 24-hour cycle, driven by your circadian rhythm, the internal clock that regulates your body.
A biomarker with a circadian pattern might peak sharply in the early morning, dip through the afternoon, and rise again by evening. This is why most blood tests are recommended to be taken in the morning, having fasted for at least eight hours.
To explore how much timing actually matters, we've aggregated anonymised blood test results from over 30,000 Thriva users across 2023 and 2024 and compared them against existing research. The patterns are consistent with what's published in the literature, and in some cases, the differences are large enough to change whether a result is flagged as abnormal.
How time of day affects testosterone results
While everyone has some of the sex hormone testosterone, males typically produce 10 to 20 times more than females. It follows a well-documented circadian pattern, with levels usually highest around 8am and declining steadily throughout the day.
How much your testosterone declines throughout the day depends on your age. A study published in the Journal of Clinical Endocrinology & Metabolism found that younger men experience a more pronounced drop, with people under 30 seeing declines of around 30% between morning and evening readings. Other research suggests this rhythm subsides with age, with people over 60 seeing smaller drops.

The practical consequence of testing outside the recommended window is that your result may fall outside established reference ranges. This isn't because your levels are clinically abnormal, but rather because of when you tested.
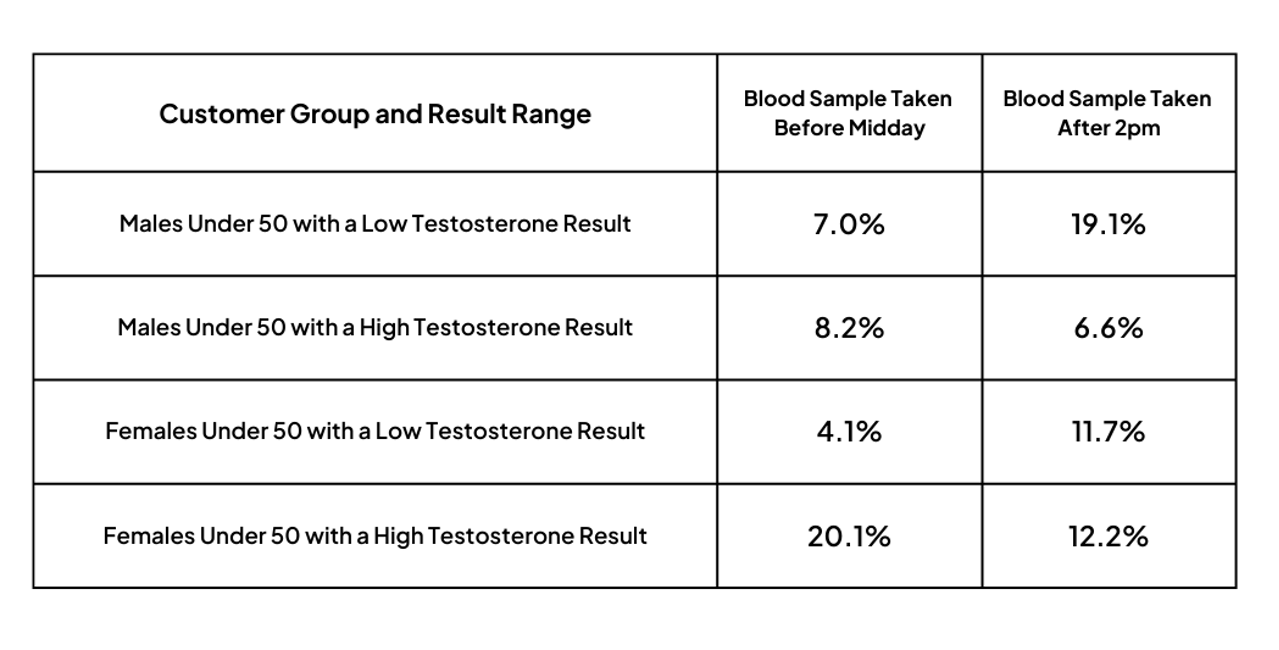
In our data, males under 50 were almost three times more likely to receive a low testosterone result (< 8.64 nmol/L) when testing after 2pm compared to before midday. Females saw a similar pattern and were also less likely to have high testosterone levels after 2pm.
How time of day affects TSH results
Thyroid-stimulating hormone (TSH) is the hormone that regulates thyroid function, and it's a key biomarker for diagnosing and monitoring thyroid conditions. The thyroid gland can be overactive (hyperthyroidism) or underactive (hypothyroidism).
High TSH levels can indicate hypothyroidism, the more common condition of the two. It affects around 2% of the population and occurs up to 10 times more frequently in women.
TSH follows a pronounced circadian pattern. A study published in Acta Endocrinologica found TSH peaks overnight between 2am and 4am and reaches its lowest point in the early afternoon.
Important: High TSH levels are rarely judged in isolation, and are usually assessed alongside other markers like low Free Thyroxine (FT4) in the diagnosis of hypothyroidism. Time of day is unlikely to influence diagnostic outcomes. However, we recommend that tests be done fasted in the morning to ensure consistency.

Our data showed that users taking their sample before 8am have average TSH levels of 2.92 mIU/L, while those testing between 10am and 5pm have levels 24% lower at 2.09 mIU/L. This made early-morning testers up to four times more likely to have high TSH (> 4.2 mIU/L).
This graph illustrates the value of testing at the same time of day to interpret your own trends. Consistent sample timing limits biological variation, making it easier to spot genuine changes.
How time of day affects serum iron results
Iron is essential for producing haemoglobin, which is the part of red blood cells that carries oxygen around your body. Too little dietary iron can lead to iron deficiency anaemia, which is most common in menstruating women and those following vegetarian or vegan diets.
On the other hand, high iron could be due to supplementation, genetic conditions such as haemochromatosis, or excessive consumption of iron-rich foods.
Important: Iron levels are rarely judged in isolation, and are usually assessed alongside other markers like ferritin and total iron-binding capacity (TIBC). These give a fuller picture of the body's iron status.

Serum iron follows a circadian rhythm, peaking in the late morning before declining from mid-afternoon.
The effect on results is clear in our data. Female users were 50% more likely to receive a low serum iron result (< 10 umol/L) when testing in the early afternoon compared to the morning.
Male users had a higher proportion of elevated serum iron results (>30 µmol/L) than females (18.6% vs 10.3%), and this percentage dropped sharply after midday.
How time of day affects triglyceride results
Triglycerides, which measure circulating fat levels, are influenced by both food intake and circadian rhythms. Levels can be higher after meals, making fasting a crucial factor when testing triglycerides. Circadian rhythms also play a role in lipid metabolism, meaning that time-of-day variations may exist even in fasting individuals.
Our data indicated a trend of rising triglyceride levels after midday, with an average of 1.42 mmol/L in samples taken before 12pm, rising as high as 2.15 mmol/L by 8pm. The threshold for high triglycerides is 1.8 mmol/L, which meant a much larger proportion of results were classified as high.

Before midday, 35.9% of results were categorised as optimal, and 19.5% were high. By contrast, after 5pm, only 16.8% are in the optimal range, while more than double the proportion of samples were high, at 46.0%.
While it’s possible for a user to be taking a test at 7am without fasting, or at 5pm fasted, it’s likely the effect we’re seeing here is down to food intake before the test.
Takeaway
These four biomarkers show the largest time-of-day effects in our dataset. The majority of biomarkers show no significant diurnal variation, so timing is less critical for those.
For the highest level of consistency in results, aim to take your test in the morning following an eight-hour fast, as described in our sample collection guidelines. This reduces natural fluctuations and makes it easier to track genuine changes.
For more of what our community data reveals, see our Year in Health Report.
We'll continue sharing insights from our anonymised dataset as we explore what community-level data reveals about individual health.
Frequently asked questions
Does the time of day affect blood test results?
Yes, for certain biomarkers. Testosterone, TSH, serum iron, and triglycerides all show measurable variation depending on when your sample is taken, driven by your circadian rhythm. For most other biomarkers, the time of day has no clinically significant effect.
What is the best time of day for a blood test?
Morning, ideally before 10am, having fasted for at least eight hours. This is when many biomarkers are at their most stable and when results align best with the reference ranges used to interpret them.
Should I fast before a blood test?
For tests including triglycerides, cholesterol, or glucose, fasting for at least eight hours is recommended. Eating before the test can raise triglyceride levels significantly, which may lead to results being classified as high when they otherwise wouldn't be. Water is fine during the fasting period.
Can time of day affect a testosterone blood test?
Yes, time of day can affect your results. Testosterone peaks around 8am and declines throughout the day, with the drop more pronounced in younger people. In our data, males under 50 were almost three times more likely to receive a low testosterone result when testing after 2pm compared to the morning.
Does it matter what time I get a thyroid test?
TSH levels are highest overnight and in the early morning, dropping to their lowest point in the early afternoon. While time of day is unlikely to change a thyroid diagnosis on its own, testing consistently in the morning gives you the most reliable baseline for tracking trends over time.
- Brambilla, D. J. et al. (2009). The effect of diurnal variation on clinical measurement of serum testosterone and other sex hormone levels in men. https://pmc.ncbi.nlm.nih.gov/articles/PMC2681273/
- Dale, J. C. et al. Diurnal variation of serum iron, iron-binding capacity, transferrin saturation, and ferritin levels. https://pubmed.ncbi.nlm.nih.gov/12090432/
- Driver, S. L. (2017). A test in context: lipid profile, fasting versus nonfasting. https://www.jacc.org/doi/10.1016/j.jacc.2017.08.006
- Ehrenkranz, J. et al. (2015). Circadian and circannual rhythms in thyroid hormones: determining the TSH and free T4 reference intervals based upon time of day, age, and sex. https://www.liebertpub.com/doi/10.1089/thy.2014.0589
- Koulouri, O. et al. (2013). Clinical significance of TSH circadian variability in patients with hypothyroidism. https://pubmed.ncbi.nlm.nih.gov/22857384/
- Mora, S. et al. Fasting compared with nonfasting lipids and apolipoproteins for predicting incident cardiovascular events. https://www.ahajournals.org/doi/10.1161/circulationaha.108.804146
- Ridefelt, P. et al. Influence of diurnal variation and fasting on serum iron concentrations in a community-based population. https://pubmed.ncbi.nlm.nih.gov/28947322/
- Thyroid UK. Overview of hypothyroidism. https://thyroiduk.org/if-you-are-hypothyroid/about-hypothyroidism/overview-of-hypothyroidism/